1. Introduction
Customer Analytics has become very important to every facet of business life. It is interpretation businesses useful in gaining deeper understanding of how business public thinks and feels. This analysis of human behavior allows companies to understand what their consumers want and need and, most importantly, why they feel the way they do
| [11] | Greene, H., Milne, G. R., 2006. Alternative data sources in targeted marketing: The value of Exographics. Journal of Targeting, Measurement and Analysis for Marketing, 14(1), 33–46. |
[11]
.
Nowadays, customers have more access to information, anytime and anywhere, on when to shop, where to buy, what to buy, how to pay, etc. This makes it essential to know the customers’ preferences and how they might behave. It is on this bedrock that this research obtained its conceptual foundation
| [5] | Callingham, M., 2004. Market Intelligence: How and Why Organizations Use Market Research, London, Kogan Page. |
[5]
, while focusing on the activities of Adventure Hardware Group.
This paper presents an insight into the empirical investigation of how Retail Outlets respond to fluctuations in customer preferences and create profit opportunities from the increased volatility without plunging revenue growth.
1.1. Statement of Problem
As companies grow from the stage of start-ups to middle-class SMEs and then Multinationals, so does their customer base. Hundreds turn to thousands, thousands to millions, and so on. Keeping track of customer’s responds become more complicated and trickier. However, knowing the patterns of customers’ behaviors provides the decision-makers with guidelines for planning their business strategy
| [4] | Cadogan, J. W., Sundqvist, S., Salminen, R. T., Puumalainen, K., 2005. Export marketing, Interfunctional interactions, and performance consequences. Journal of the Academy of Marketing Science, 33(4), 520-535. |
[4]
.
The constant change in consumer behavior and interest has created many gaps in businesses, hence the need for thorough customer insight analytics to bridge those gaps and help businesses know how best to respond to changes.
1.2. Objectives of the Study
The primary goal of this study is to gain customer demography visibility and make business recommendations for Adventure Hardware Group. With the use of data visualization, it will be possible to collect and gain insight from customer data, segment customers into groups based on common characteristics, understand buying patterns, predict future customer behavior, and ultimately make business decisions that create a successful campaign and a satisfying customer journey analytics solution that will retain and attract customers.
1.3. Significance of the Study
The conduct of this study will impact the business in the following ways:
1) The increase in response rates, customer loyalty and, ultimately, sales revenue and profit.
2) Reduced campaign costs because it will become much easier to target the right customers.
3) Decrease in attrition because it will become easier to accurately predict customers most likely to leave and develop suitable proactive campaigns to retain them.
4) Deliver the right messages by segmenting customers more effectively and better understanding target populations.
1.4. Research Questions
This research aims to answer the following questions;
1) Has there been a change in demography in the last four years?
2) If there was a change, does it have any impact on revenue?
3) What year experienced significant growth?
4) Is age a determining factor in the purchase of bikes?
5) Does the age variable impact revenue?
6) Did the change in demography lead to an increase in revenue?
7) What is the adoption rate of online stores?
8) Has there been any prevalent buying pattern?
1.5. Research Methods and Analysis
We will primarily make use of secondary data from Adventure Group. Their database will be queried with Structured Query Language (SQL) to accurately single out relevant data sets. The data set’s analysis, presentation, and visualization will be done with Power BI as insights are provided.
The result, when presented, will assist us in making recommendations to Adventure Hardware and any other business on possible pricing, promotions, and customer segmentation, which should boost their competitive advantage.
2. Literature Review and Theoretical Framework
2.1. The Concept of Customer Insight Analytics
Few things in business are more challenging than understanding the customers’ exact wants, needs, and desires. It’s even more challenging to prove that what you think you know is true—and encompasses your entire customer base. That’s why marketers and executives rely on a combination of qualitative and quantitative data to draw on the customer insights when there is the need to make smarter decisions
| [3] | Bock, G.-W., Kim, Y.-G., 2002. Breaking the myths of rewards: An exploratory study of attitudes about knowledge sharing. Information Resources Management Journal, 15(2), 14. |
[3]
.
This literature review is a descriptive summary of previous research on Customer Insight Analytics. The study compares, contrasts, and connects findings from the reviewed research work. The ultimate purpose is to establish an educational research context for our capstone project by comprehensively identifying what is known about customer insight analytics. Incidentally, there hasn’t been any literature or research done on Adventure Hardware Group and Customer Insight Analytics.
2.1.1. Some Definitions of Customer Insight Analytics
Customer analytics have been defined by various authorities as follows:
1. Customer Insight Analytics is a process by which data on customer behavior is used to help make critical business decisions via market segmentation and predictive analytics.
2. Customer analytics refers to the processes and technologies that give organizations the customer insight necessary to deliver anticipated, relevant and timely offers.
3. Customer analytics, also called customer data analysis, is the process of collecting and analyzing customer data to gain insights into customer behavior.
4. Customer insight is the understanding and interpretation of customer data, behaviors, and feedback into conclusions that can be used to improve product development and customer support.
5. Customer insights are interpretations of quantitative and qualitative data gathered from customer feedback and other informational sources, which are then compiled and analyzed to inform business decisions.
6. Customer insight is an interpretation that businesses use to deeply understand their potential customers and target the audience’s needs and perspectives
| [8] | Dixon, N., 2002. The neglected receiver of knowledge sharing. Ivey Business Journal, (March/April), 35-40. |
[8]
.
Customer analytic is often referred to as Customer Insight, Customer Insight Analytics or Customer Intelligence.
2.1.2. Essential Elements of Customer Insight Analytics
The main elements of Customer Insight Analytics are:
Data quality: Customer data management is a foundational requirement for the work of all the other teams. The quality of any behavioral analysis, predictive analytics, or database marketing targeting is dependent on the use of quality data. Data quality also impacts the work of much of today’s research. From targeted samples to data capture, data quality is vital
| [7] | Davenport, T. H., 2006. Competing on analytics. Harvard Business Review, 84(1), 98-107. |
[7]
.
Analytics teams: The data scientist skill set seems to be in greater demand than ever. Data Scientist roles, although claimed to require more IT skills, overlap strongly with the mixture of SQL programming and statistical skills. The focus of recent hype around ‘big data’ and ‘predictive analytics’ has more often been analytics teams. Behind the hype and long before it, the role of data analytics teams was essential to understanding how your customers are behaving and how they might behave in the future. Demographic and behavioral profiling is still essential to improve customer understanding, complementing segmentation where appropriate. However, forecasting, identification of triggers, and predictive models enable targeted actions that will improve customer engagement and value share in the future.
Consumer research: Although there is great power in being able to spot patterns in customer behavior or predict their response, without understanding customers’ pattern of behavior, there is a significant risk of misinterpretation. In other words, it is not just enough to know how customers behave; one also needs to know why.
Effective marketing communication requires accurate targeting and a design that engages a customer accessibly and emotionally
| [12] | Hall, H., 2001. Input-friendliness: motivating knowledge sharing across intranets. Journal of Information Science, 27(3), 139. Hansen, M. T., Nohria, N., Tierney, T., 1999. |
[12]
. Businesses can incur huge losses if they neglect a customer’s behavior and how they may be making choices.
Database marketing: Sometimes viewed as the preserve of direct marketing businesses, with its long history of enriching direct mail and catalog companies, database marketing is vital to realizing customer insight. As with most change processes, a culture of test and learn is needed to test actions and refine them until an optimal return is generated. This is because even if analysis and research converged and reveal an accurate understanding of customers and of the offers and communications that would be welcomed at the right time, without a robust way of testing such hypothesis, it remains a conjecture
.
Database maintenance and online marketing bring the scientific method to bear on customer insight work. As most businesses now operate multi-channel, through-the-line media mixes, this discipline has expanded to benefit from econometrics and other more complex measurement techniques. Influential control groups, feedback loops, statistical significance, and measurement ensure an understanding of marketing payback, as evidenced by Shaw & Merrick
| [9] | Elliott, K., Scionti, R., Page, M., 2004. Two rivers. Quirk’s Marketing Research Review, XVIII (5), 66, 68, 70, 72, 74-75. |
[9]
.
2.1.3. Importance of Customer Insight Analytics
The answer to the question on why customer analytics is important is simple: understanding what your customers need and want is intrinsic to your business’ success. Customer insight analytics allow your business teams to understand how your customers think and feel about your products and services
| [14] | LaValle, S., Lesser, E., Shockley, R., Hopkins, M. S., & Kruschwitz, N. (2013). "Big data, analytics and the path from insights to value", MIT sloan management review, 21. |
[14]
. Knowing this will enable you to build deep customer empathy beyond understanding what they need and exactly why they need it.
Moreso, this form of listening to your customers allows you to create ever-improving experiences that stand the test of time. Today it could be a global pandemic, and tomorrow it could be something else. Notwithstanding, the point remains that constantly collecting and analyzing customer insights will always give you a clear sense of direction in your business relationship with your customers
| [17] | Evans, James R., and Carl H. Lindner. (2012). "Business analytics: the next frontier for decision sciences." Decision Line 43.2 4-6. |
[17]
.
2.1.4. The 5 Principles of Customer Insight Analytics
Customer analytics is not just about analyzing data but also entails the approach required to synthesize that information and take the necessary steps for greater engagement
| [16] | Lycett, M. (2013). "'Datafication': Making sense of (big) data in a complex world", European Journal of Information Systems, 22(4), 381–386. |
[16]
.
Businesses can indeed benefit from the five core elements of customer data that can provide powerful insights:
1) Sentiment analytics: This practice refers to measuring customer feedback and their affinity towards your products, services, and the brand as a whole.
2) Customer 360: This is a holistic approach that studies complete datasets related to the customers’ activities. It helps you assess when a customer is about to leave.
3) Customer segmentation: This is an excellent way to understand what works for your customer base. Ultimately, segmentation helps strengthen your customer relationship through a targeted approach.
4) Next best offer: This involves supplying what is needed at the right time at the right price. Keep customers engaged and get them to try new things.
5) Journey analytics: Utilize the proper channels and sales readiness for conversions
| [11] | Greene, H., Milne, G. R., 2006. Alternative data sources in targeted marketing: The value of Exographics. Journal of Targeting, Measurement and Analysis for Marketing, 14(1), 33–46. |
[11]
.
2.2. Articles on Turning around Failing Organizations: Insights for Educational Leaders
Below are summaries of curated peer-reviewed journal articles that provide a comprehensive, critical analysis of customer insight analytics in varying contexts.
Murphy, Joseph, Journal of Educational Change, May 2010 reviewed the organizational sciences to develop a grounded narrative of a turnaround in education.
1) Approach: This review of literature explored the approach of employing an integrated process to unpack and make sense of the turnaround literature from the organizational sciences. Strategies appropriate for document analysis, and borrow analytics (e.g., demoing, coding) employed with interview data, were relied on.
2) Findings: We examine seven defining themes that flow from our review of empirical and theoretical work on organizational recovery in firms, non-educational public agencies, and not-for-profit organizations: (1) not all failing schools are worth saving; (2) focus on leadership; (3) act quickly; (4) diagnose first; (5) emphasize efficiency moves; (6) create a sense of hope; and (7) backward map from the customer and focus on core activities linked to valued outcomes.
3) Implications: We posit that the literature on turning around failing organizations in sectors outside of education provides blueprints for recovery activity in failing schools. The implications for turnaround leadership are powerful.
4) Originality: This is the first systematic effort to mine research in the corporate, not-for-profit, and public sectors to develop insights for turning around failing schools.
2.3. Consumer Insight as Competitive Advantage, Using Big Data and Analytics
Adnan Veysel Ertemel, Istanbul Ticaret University, January 2015
The digital revolution serves as a competitive advantage to businesses that can analyze consumer behavior to gain insights for their strategic advantage. After the advent of the Internet, the past two decades witnessed the generation of vast business data. The amount of data is so huge that traditional database management system approaches fall short of managing and analyzing this data. This paper explores the characteristics of this phenomenon called Big Data together with Analytics as a tool for marketers to gain insights about consumer behavior and hence provide a competitive advantage to businesses. It also discusses some best practices as case studies.
2.4. Better Customer Insight - in Real Time
Emma K. Macdonald, Hugh N. Wilson, Umut Konuş
From the Magazine (September 2012)
To identify what influences the attitudes and behavior of customers, most companies rely on surveys, focus groups, and ethnographic research. The trouble is that surveys and focus groups tap customers’ unreliable memories, and the presence of observers can cause customers to alter their behavior. The authors, three academics, believe they have found a new research tool without those flaws: real-time experience tracking. Conducted over mobile phones, RET allows companies to inexpensively collect instant, unbiased feedback from customers 24 hours a day.
In RET, participants supply the answers to a four-question survey every time they encounter a brand, be it through direct interaction, such as a purchase or ad, or an indirect one, such as a conversation with another customer. The process is straightforward: They need only text a four-character message. One significant benefit is that RET allows firms to track campaigns as they unfold and readjust them toward the most effective tactics.
2.5. Beyond Segmentation: A Critical Examination of Customer Insights in Contemporary Services Marketing
Christine Bailey, Paul R. Baines, Hugh Wilson & Moira Clark
Pages 227-252 | Published online: 01 Feb 2010
The bulk of market segmentation literature has concerned the generation of segments, with far less attention paid to what segmentation is used for – particularly surprising given the common speculations that the role of segmentation is changing due to CRM practices and the broader range of forms of customer insight that they enable.
We explore market segmentation in the services and product-service systems context through twenty-five interviews in five UK-based companies, highlighting practical considerations in implementing market segmentation programs (see Young, Ott, and Feigin 1978, for a similar early approach). Within this case set, market segmentation, using a variety of segmentation bases, is still regarded as essential for customer selection, proposition development, and mass communication.
However, addressable and interactive communications with individual customers are increasingly based on individualized customer analytics and propensity modeling, which aid the determination of the likelihood of uptake of specific propositions
| [15] | Gallagher, C., Furey, E., & Curran, K. (2019). The Application of Sentiment Analysis and Text Analytics to Customer Experience Reviews to Understand What Customers Are Really Saying. International Journal of Data Warehousing and Mining (IJDWM), 15(4), 21-47. https://doi.org/10.4018/IJDWM.2019100102 |
[15]
. Events and triggers informing companies how to deal with customers individually are also considered particularly effective rather than simply allocating the customer to a particular characteristic segment. Implications for theory and practice in market segmentation are outlined, and further research is required to explore this critical area further.
2.6. Unveiling Customer Sentiment: A Text Mining Approach to Analyzing Customer Experience Reviews
Conor Gallagher (Letterkenny Institute of Technology, Donegal, Ireland), Eoghan Furey (Letterkenny Institute of Technology, Donegal, Ireland), and Kevin Curran (Ulster University, Derry, UK).
International Journal of Data Warehousing and Mining (IJDWM) 15(4) Copyright: © 2019 |Pages: 27
In a world of ever-growing customer data, businesses must have a clear line of sight into what their customers think about the business, its products, people, and how it treats them. Businesses need to access and mine their customer data to drive a modern customer experience. Insight into these critical areas for a business will aid in developing a robust customer experience strategy and, in turn, drive loyalty and recommendations to others by their customers.
This article investigates the use of a text mining approach to aid sentiment analysis in understanding what customers say about products, services, and interactions with a business. This is commonly known as Voice of the Customer (VOC) data, which is key to unlocking customer sentiment.
The authors analyze the relationship between unstructured customer sentiment in the form of verbatim feedback and structured data in the form of user review ratings or satisfaction ratings to explore the question of whether customers say what they think when allowed to provide free text feedback as opposed to how they rate a product on a scale of one to five.
Using various Sentiment Analysis approaches, the authors assign a sentiment score to a piece of verbatim feedback and then categorize it as positive, negative, or neutral. Using this normalized sentiment score, they compare it to the corresponding rating score and investigate the potential business insights
.
The results indicate that a business cannot rely solely on a standalone metric as a source of truth regarding customer experience. There is a significant difference between the customer rating score and the sentiment of their corresponding review of the product. The authors propose that businesses must supplement their customer feedback scores with a robust sentiment analysis strategy.
2.7. Case Study: In-Depth Customer Insight: A Winning Go-to-Market Advantage for a Leading Insurance Company
By Mark Smith, Executive Vice President, Portrait Software
The Issue: Falling Profits, Flagging Loyalty, October 29, 2008.
A large insurance industry icon, which we’ll call “LIII,” needed to develop a strategy and process that would enable it to retain customers and minimize risk over an extended period. A project team was assembled to evaluate the company’s general insurance value chain. It quickly became a determined prediction that LIII’s marketing and sales had fallen short of creating a compelling customer experience.
The company recognized that it had a fragmented view of the customer. However, a better and deeper understanding of its customers would foster a deeper and more intelligent engagement, positively affect the company, and improve its bottom line. The company possessed volumes of information about its customers but had no process in place, nor did it have a comprehensive way to cull the information necessary to enable the segmentation of its customer base.
Without the capability to look at the individual customer, LIII would continue to spend money unnecessarily by targeting the wrong people at the wrong time. This lack of insight had several negative implications, including customer dissatisfaction, increased risk, and faster attrition.
The team embarked on a mission to develop an internal customer insight capability and support technology infrastructure.
2.7.1. Leveraging Uplift Modeling for Improved Cutomer Targeting and Incremental Revenue Generation
Insight for Incremental Revenue was done in order to gain the desired depth of insight, the team made key technology infrastructure improvements, including the addition of Uplift modeling as an extension of the existing Quadstone Customer Analytics solution (an analytics product from Portrait Software for segmenting and profiling customer data)
| [14] | LaValle, S., Lesser, E., Shockley, R., Hopkins, M. S., & Kruschwitz, N. (2013). "Big data, analytics and the path from insights to value", MIT sloan management review, 21. |
[14]
.
Their two main objectives for refining the targeting approach were to remove the negative effects of the retention programs and to identify customers who renew only because they are contacted.
Portrait Uplift modeling was applied to business processes and systems to enable insight into the individual customer and to provide information that helped the company target its direct marketing to only those customers who would respond positively (not just those who were likely to respond, which could include “negative” responses)
| [1] | Bednall, D. H. B., Valos, M. J., 2005. Marketing research performance and strategy. International Journal of Productivity & Performance Management, 54(5/6), 438-450. |
[1]
. The ability to quickly infuse innovative analytics into business processes resulted in tremendous cost savings and increased the view into the customer base.
2.7.2. Uplift Modeling for Optimized Retention Campaigns: Increased ROI and Reduced Customer Churn
Stellar Retention Results – LIII estimates that by applying this approach early to a single retention campaign, the total cost of implementing Uplift modeling will produce a 152% return on investment within the first year
| [1] | Bednall, D. H. B., Valos, M. J., 2005. Marketing research performance and strategy. International Journal of Productivity & Performance Management, 54(5/6), 438-450. |
[1]
. The technique applies to a range of retention and acquisition campaigns
| [9] | Elliott, K., Scionti, R., Page, M., 2004. Two rivers. Quirk’s Marketing Research Review, XVIII (5), 66, 68, 70, 72, 74-75. |
[9]
.
Increased marketing ROI was achieved by implementing Uplift modeling, which resulted in the following:
1) Reduced contact volumes
2) Increased retention rate or maintenance at a lower cost
3) Reduced missed opportunity costs
4) Increased customer satisfaction by eliminating counterproductive calls
| [3] | Bock, G.-W., Kim, Y.-G., 2002. Breaking the myths of rewards: An exploratory study of attitudes about knowledge sharing. Information Resources Management Journal, 15(2), 14. |
[3]
.
Throughout the course of developing the consumer insight solution, the company experienced several analytical breakthroughs:
1) Reduced number of customers wanting to cancel
2) Improved direct mail cost per sale (CPS) and ROI
3) Improved door-dropping CPS and ROI
4) Identified the best time and way to approach ex-customers or not-taken-up-quote
5) Identified cross-media dynamics of response (online and offline)
6) Geographical analysis to identify bestselling practices and share
| [7] | Davenport, T. H., 2006. Competing on analytics. Harvard Business Review, 84(1), 98-107. |
[7]
.
2.7.3. Leveraging Customer Insight Analytics for Enhanced Market Adaptability and Profitability
Flexibility and Long-Term Sustainability Pays High Dividends – Based on technology from Portrait, the customer insight solution was designed to help the organization quickly adapt to changing market conditions and business requirements. The company built both intelligence and flexibility into the solution to enable quick analyses of customer behaviors and on-the-fly modifications of offers. The company initially considered a five-year timeframe when embarking on the solution
| [8] | Dixon, N., 2002. The neglected receiver of knowledge sharing. Ivey Business Journal, (March/April), 35-40. |
[8]
. However, LIII has established a solution that is easily repeatable and extendable across all customer campaigns, based upon its inherent ability to reevaluate customer interactions within its business processes quickly and with the benefit of analytics. This has significantly impacted the organization’s marketing profitability and the ability to deliver highly focused and targeted customer campaigns linked to customer needs
| [6] | Clancy, K. J., Berger, P. D., Magliozzi, T. L., 2003. The ecological fallacy: Some fundamental research misconceptions corrected. Journal of Advertising Research, 43(4), 370- 380. |
[6]
.
Finally, despite the scarce literature on Customer Insight Analytics, one thing is evident from the few; Consumer insight can provide a business or any entity with the opportunity to better personalize and tailor products to the needs, wants, and demands of their customers
| [5] | Callingham, M., 2004. Market Intelligence: How and Why Organizations Use Market Research, London, Kogan Page. |
[5]
. According to Microsoft, organizations that leverage their customer behavior to generate insights outperform their peers by about 85% in sales growth.
Businesses can use these insights to expand their product/service offerings, develop new marketing strategies, create detailed customer personas and customer journey maps, and enhance current offerings
| [12] | Hall, H., 2001. Input-friendliness: motivating knowledge sharing across intranets. Journal of Information Science, 27(3), 139. Hansen, M. T., Nohria, N., Tierney, T., 1999. |
[12]
. Because smart use of customer insights is intended to improve customer experience, it can also mean more revenue
| [2] | Berinsky, A. J., 2006. American public opinion in the 1930s and 1940s. Public Opinion Quarterly, 70(4), 499-529. |
[2]
.
Customers also have higher expectations when it comes to customer service. According to Bain & Company, an excellent customer service experience will earn loyalty and “turn customers into promoters with a lifetime value of 6 to 14 times that of detractors.” Additionally, companies that do well with customer service grow 4-5% above their market
| [10] | Gold, A. H., Malhotra, A., Segars, A. H., 2001. Knowledge management: An organizational capabilities perspective. Journal of Management Information Systems, 18(1), 185-214. |
[10]
.
Conclusively, it is safe to say that by using customer insights to inform strategic and tactical decisions, you can develop relationships with your customers, better understand the connected customer, and generate meaningful and quantifiable results.
3. Research Methodology
This describes the research methodology for the study. It explains the sources of data and the nature of the sourced data for the research. The research methodology focuses on the data that will ensure an objective and critical analysis of Adventure Works Group. It describes the types of data used, method of collection, model specification, model evaluation, estimation, data presentation and analysis techniques. This research work has a mix of quantitative and qualitative analysis. The inquiry into the customer journey and the insight analytics bring the qualitative nature to the fore. In contrast, the presentation of data related to the research variables brings to the fore the quantitative nature
| [15] | Gallagher, C., Furey, E., & Curran, K. (2019). The Application of Sentiment Analysis and Text Analytics to Customer Experience Reviews to Understand What Customers Are Really Saying. International Journal of Data Warehousing and Mining (IJDWM), 15(4), 21-47. https://doi.org/10.4018/IJDWM.2019100102 |
[15]
.
3.1. Sources of Data
Data for analyses such as this are not easily accessible; even if they are, they are usually in formats that can’t be opened without using some tools. The data used for the study were essentially secondary and were in aback file which can only be queried with a Structured Query Language (SQL) server. The essence was to get to an objective result of proving a quantitative measure of the change in customer demography of Adventure Work Group in the last four years and to determine if this change has had any impact on revenue.
3.2. Data Description, Cleaning and Analysis
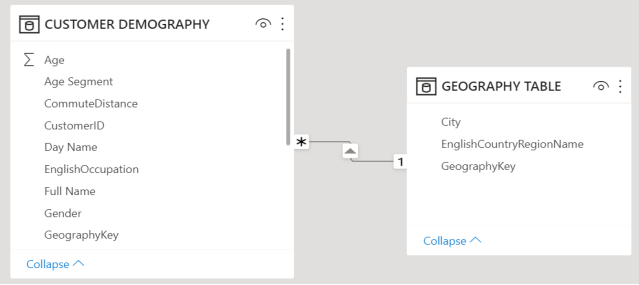
The dataset comprises 1406 unique customers who have bought from either online or offline channels. The demography covers customers from 6 countries and 562 cities. Analysis was carried out using two distinct tables: the Customer demography table and the geography table. The customer demography table is a combination of the Sales Order header table and the Dim. Customer table are from the AdventureworksDW2012. The fact table and the dimension table were modeled in PowerBI using the geography key. Dax measures were created for analysis to enhance the creation of visuals.
3.2.1. Data Description
Both data sets were queried from the Adventure Works database using the query below:
Customer Demography Table
SELECT [CustomerID],
[OrderDate],
[OnlineOrderFlag],
[TerritoryID],
[FirstName],
[LastName],
[BirthDate],
[MaritalStatus],
[Gender],[YearlyIncome],[GeographyKey],
Geography Table
1) GeographyKey
2) City
3) EnglishCountryRegionName
[TotalChildren], [EnglishOccupation],[CommuteDistance], [TotalDue]
FROM [Sales].[SalesOrderHeader] AS SOH
LEFT JOIN [AdventureWorksDW2012].[dbo].[DimCustomer] AS DC
ON SOH.[CustomerID] = DC.[CustomerKey]
Geography Table
SELECT [GeographyKey], [City], [EnglishCountryRegionName]
FROM [dbo].[DimGeography]
The data set is the combination of two distinct tables, namely, the Customer Demography Table and the Geography Table. Both tables have been modelled with the geography key.
Figure 1. Model view of Customer demography and Geography table.
Table 1. Column headers for both tables.
SN | Customer Demography Table | Geography Table |
1 | CustomerID | GeographyKey |
2 | OrderDate | City |
3 | OnlineOrderFlag | EnglishCountryRegionName |
4 | TerritoryID | |
5 | FirstName | |
6 | LastName | |
7 | BirthDate | |
8 | MaritalStatus | |
9 | Gender | |
10 | YearlyIncome | |
11 | GeographyKey | |
12 | TotalChildren | |
13 | Englishoccupation | |
14 | CommuteDistance | |
15 | TotalDue | |
The attribute of each table has been highlighted in the table above, and each data entry has the following features:
SN: Customer Demography Table
1: Customer ID: This serves as the primary key and a unique identifier assigned to each customer.
2: Order Date: This refers to the date customers ordered the products.
3: OnlineOrderFlag: In this case, 0= In-store purchase, and 1= online purchase.
4: TerritoryID: This is the identity of the country and territory tied to the customer.
5: FirstName: This is the first name of the customer.
6: LastName: This is the last name of the customer.
7: BirthDate: This refers to the date of birth of the customers.
8: MaritalStatus: This refers to whether the customer is single or married (S= Single, M= Married)
9: Gender:: This refers to the gender of the customer, streamlined to just male and female (M= Male, F= Female).
10: YearlyIncome: This refers to the income earned by the customer yearly (in dollars)
11: GeographyKey:
12: Total Children: This refers to the number of children the customer has.
13: EnglishOccupation: This refers to the classification of the customer's discipline or career structure (Professional, Manual, Skilled Manual, Clerical, Management)
14: CommuteDistance: This largely speaks about the proximity of the customers to the location.
15: TotalDue
3.2.2. Data Cleaning and Manipulation
The data cleaning was done in Power BI power query, and some data transformation was done using conditional columns.
Table.AddColumn (#"Changed Type2", "Sales Channel", each if [OnlineOrderFlag] = 1 then "Online" else if [OnlineOrderFlag] = 0 then "Physical Store" else null)
Table.AddColumn (#"Merged Columns", "Age Segment", each if [Age] <= 39 then "30's" else if [Age] <= 49 then "40's" else if [Age] <= 59 then "50's" else if [Age] <= 69 then "60's" else if [Age] <= 79 then "70's" else if [Age] >= 80 then 80 else null)
Table.CombineColumns (#"ChangedType3", {"FirstName", "LastName"}, Combiner.CombineTextByDelimiter (" ", QuoteStyle.None), "Full Name")
Table.ReorderColumns (#"Expanded Query1 (2)", {"CustomerID", "Query1 (2). GeographyKey", "OrderDate", "TerritoryID", "Full Name", "MaritalStatus", "Gender", "YearlyIncome", "TotalChildren", "EnglishOccupation", "CommuteDistance", "TotalDue", "Age", "Age Segment", "Year", "Month Name", "Day Name", "Sales Channel", "Month"}).
3.2.3. Data Preparation
Data preparation is the process of gathering, combining, structuring, and organizing data so it can be used in business intelligence (BI), analytics, and data visualization applications
.
The data preparation for this research was done in a series of steps. The steps are highlighted below:
Data collection: The data for this project is secondary data sourced from the Adventure Works database and downloaded as a backup folder which was restored and backed up on the local computer using a Microsoft SQL server backup folder in the local disc.
Data discovery and profiling: After a successful backup, the entire database was profiled and examined to understand the objects and tables containing customer and sales information, considering these are the essential tables of interest.
Data cleansing: Next, the identified data errors and issues are corrected to create complete and accurate data sets. For example, as part of cleansing data sets, faulty data is removed or fixed, missing values are filled in, and inconsistent entries are harmonized.
Data structuring: At this point, the data was modeled and organized to meet the analytics requirements. For example, data stored in comma-separated values (CSV) files or other file formats has to be converted into tables to make it accessible to BI and analytics tools.
Data transformation and enrichment: In addition to being structured, the data typically must be transformed into a unified and usable format. For example, data transformation may involve creating new fields or columns that aggregate values from existing ones. Data enrichment further enhances and optimizes data sets as needed through measures such as augmenting and adding data.
Data validation and publishing: In this last step, automated routines are run against the data to validate its consistency, completeness, and accuracy. The prepared data is then stored in a data warehouse, a data lake, or another repository and either used directly by whoever prepared it or made available for other users to access
| [16] | Lycett, M. (2013). "'Datafication': Making sense of (big) data in a complex world", European Journal of Information Systems, 22(4), 381–386. |
[16]
.
3.2.4. Join Types
In relational databases, such as SQL Server, Oracle, MySQL, and others, data is stored in multiple related tables with a common key value. Accordingly, there is a constant need to extract records from two or more tables into a results table based on some condition.
Merging two data sets using SQL or SQL tools can be accomplished through JOINS. A JOIN is an SQL instruction in the FROM clause of your query that is used to identify the tables you are querying and how they should be combined.
Here are the different types of JOINs in SQL:
1) (INNER) JOIN: Returns records that have matching values in both tables
2) LEFT (OUTER) JOIN: Returns all records from the left table and the matched records from the right table
3) RIGHT (OUTER) JOIN: Returns all records from the right table and the matched records from the left table
4) FULL (OUTER) JOIN: Returns all records when there is a match in either the left or right table.
For this study, left join was used to merge the Sales Order header table from the Adventureworks2012 database and the Dim. Customer table from AdventureworksDW2012, using the CustomerID. This combined table provided every customer’s personal information and sales history for a period of four years.
3.3. Data Presentation and Analysis Techniques
The obtained data were presented in tables, graphs, charts, and other tools of descriptive statistical analysis. The data was further subjected to empirical statistical analysis using frequency percentages in tables, graph and charts; aimed at drawing a reliable inference on the change in customer demography and its impact on revenue. Therefore, the outcome of this analysis constituted part of the research findings and influenced policy recommendations. The study employed Power BI, a Business Intelligence and Data Visualization tool for converting data from various data sources into interactive dashboards and analysis reports.
Power BI enables data scientists and analysts to turn data sets into engaging, interactive, and insight-enhancing reports, dashboards, and visuals used to monitor the course of business strategies.
Data analytics with Power BI promotes the discovery of information and the democratization of data through its unique data visualization capabilities that improve the quality of companies’ informative systems and help management make data-driven decisions. Power BI streamlines data analysts’ work and makes it easy to connect, transform, and visualize data.
The main reason for the adoption of Power BI for this study is its ability to carry out insightful analysis to make informed data-driven decisions.
4. Results and Discussion
Customer Insight Analysis
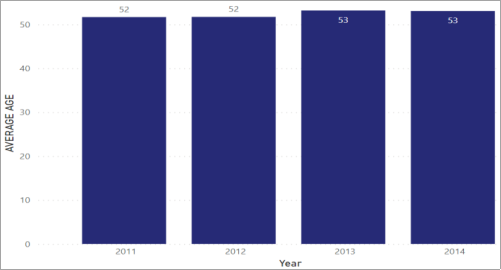
Figure 2 below indicates that in the last four years, the average age of customers who purchased the products hovered around the ages of 52 and 53, which can be considered stable.
Figure 2. Showing Total Age Segmentation and Year.
On the other hand, the revenue over the same period fluctuated significantly. This implies that there is no direct relationship between average age and total revenue. Several other factors could have accounted for the fluctuations in the revenue, other than the average age.
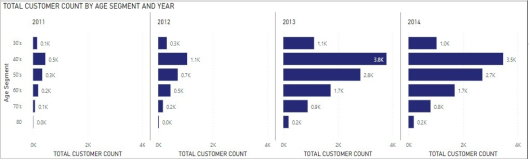
Figure 3. Showing Total Customer Count by Age Segmentation and Year.
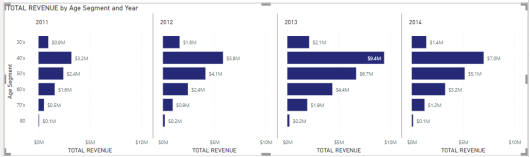
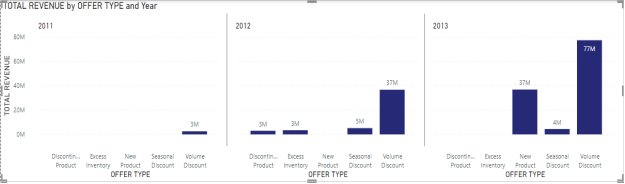
Figure 4. Showing Total Revenue by Age Segment and Year.
Figure 4 shows that the age range of the customers is more in their 40s, and it remained increasingly consistent within the four years. It also shows that customers in their 70s and 80s were the least in the mix until 2013 when customers in their 80’s started coming on board.
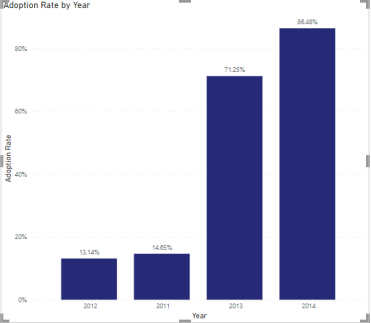
Figure 5. Showing Adoption Rate by Year.
The
figure 5 shows the adoption rate of online purchases of the products. It reveals a slight decrease in 2012, picking up again consecutively between 2013 and 2014. This also indicates that although demography hasn't changed, the adoption of online channels has continued to increase.
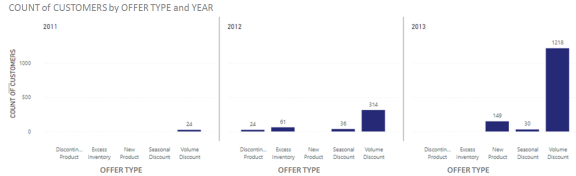
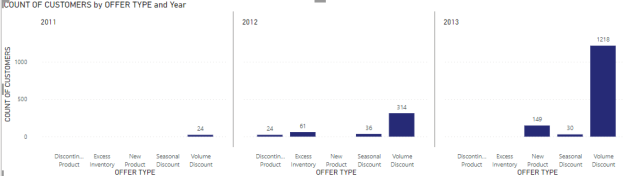
Figure 6. Showing Count of Customers by Offer Type and Year.
Across all metrics, there was significant growth between 2012 and 2013; this happened as a result of the introduction of new products and volume discounts in sales; hence, leading to more sales volume and generating increased revenue.
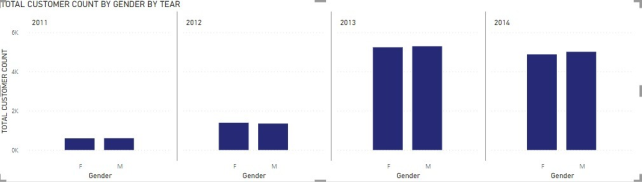
Figure 7. Showing Total Customer Count by Gender by Year.
The
figure 7 shows the customer count by gender within the four years under consideration.
The count grew over the years without a significant gap between males and females. This also shows that the purchase of products is evenly distributed between males and females consistently year on year.
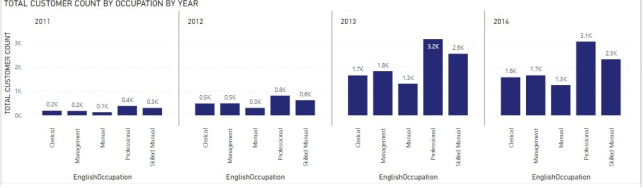
Figure 8. Showing Customer Count by Occupation by Year.
The
figure 8 shows the customer count by occupation per year. It reveals that customers who are professionals maintained the lead over the years, while customers whose occupations are manual maintained the least over the years consistently, showing that professional customers are more likely to buy bikes than customers who are not. This same pattern is maintained year on year.
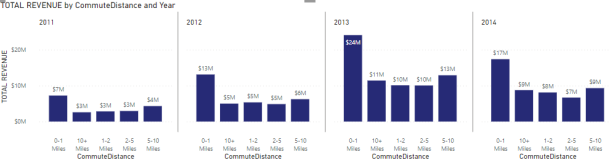
Figure 9. Showing total Revenue by Commute distance and Year.
The
figure 9 shows that customers who commute by the proximity of 0–1 mile comprised more of the customer base and remained consistent over the years. However, those that commuted for more than 10 miles constitute the least. This shows that most customers who commute short distances are more likely to buy bikes. This pattern is maintained year on year.
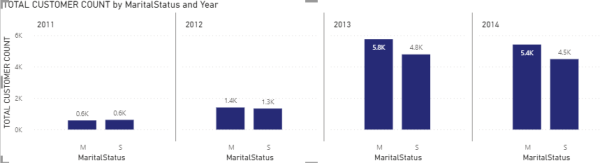
Figure 10. Showing Total Customer Count by Marital Status and Year.
The
figure 10 shows that in 2011, there was an even distribution between married and single customers. However, from 2012, married customers grew more consistently over the years than single customers. This also indicates that there has been a shift in customer demography towards the male gender.
Table 2. Showing the Customer Count by Occupation per year.
Gender | Numbers of customers | EnglishOccupation | Number of customers | MaritalStatus | Number of customers | Age Segment | Number of customers |
F | 25 | Professional | 31 | S | 12 | 40’s | 2 |
M | 25 | Management | 15 | M | 38 | 70’s | 9 |
| | Skilled Manual | 4 | | | 50’s | 9 |
| | | | | | 60’s | 30 |
The
table 2 shows the customer count by occupation per year. It reveals that customers who are professionals maintained the lead over the years while customers whose occupations are manual maintained the least over the years consistently, showing that professional customers are more likely to buy bikes than customers who are not. This same pattern is maintained year on year.
Finally, we looked at the age segment of the top 50 customers by revenue and discovered that most customers are in their 60s. This doesn’t align with the entire customer base. However, when we looked closely at the locations with higher customer counts, we could see that more customers are in countries with higher life expectancy ratios, showing that locations with much older people tend to buy more bicycles.
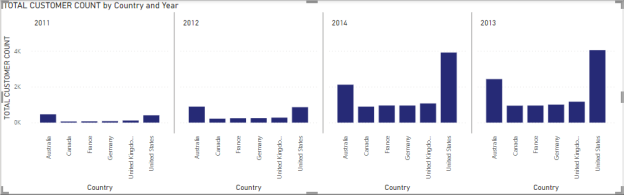
We looked at the customer count across all six countries where AHG has outlets, and we could tell that the customer demography has remained the same over the past four years. Australia and the United States have remained the areas with the highest customers throughout the period under consideration.
Figure 11. Showing Total Customer Count by Country and Year.
Figure 12. Showing Count of Customers by Offer Type and Year.
Figure 13. Showing Total Revenue by Offer Type and Year.
Special offers and promotions by the marketing team were also considered, and it became evident why we had significant growth in 2013. This was because of the offers in 2012, as the company pushed out many new offers to attract new customers. New product introduction also helped in 2013 as over 149 new customers were onboarded, while volume discounts appear to be the most effective year on year, generating over 1218 customers. This is also reflected in terms of revenue, as seen in
Figure 13.
Figure 14. Scatter Plots Showing Relationships and Patterns of the Two Discussed Variables.
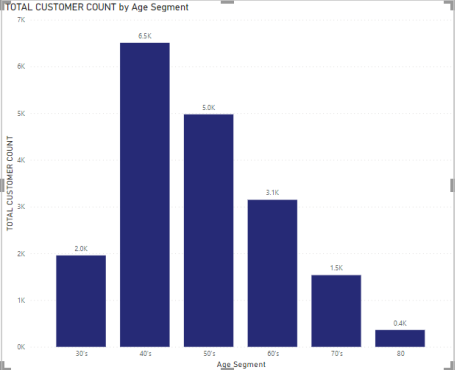
Figure 15. Showing Total Customer Count by Age Segment.
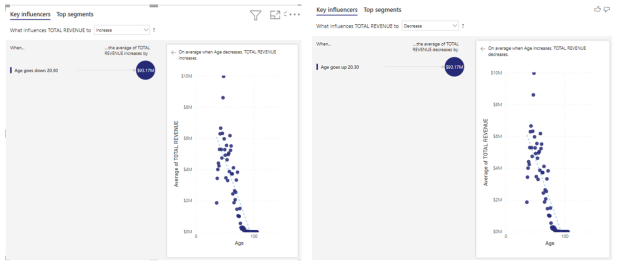
We also looked at how the average customer population has affected sales, and we could see that year on year when the average age goes up by +20years, revenue comes down to about 93.17 million. This means that the younger the generation, the more revenue; even though the company has an older generation bringing in more income, the company can leverage the population of the younger customers to make higher revenue. We can also see from
Figure 15 that the population is positively skewed, showing that we have younger customers than much older ones, i.e. from age 50 and below.
Key influencer Analysis
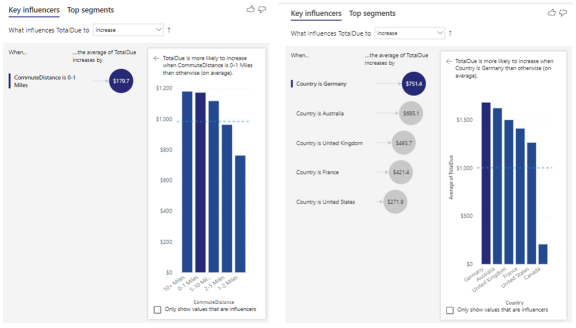
Figure 16. Showing the Key Influencers and Top Segments.
This analysis shows that customers who have between 0-1 average commute distance are likely to improve revenue in terms of the overall commute distance of customers. Also, considering the customers’ location, Germany has the most significant influence on the revenue generated. However, the number of customers from Germany is not so many. Improving customer count in Germany can significantly improve revenue. Other locations in descending order are Australia, the United Kingdom, France, and the United States.
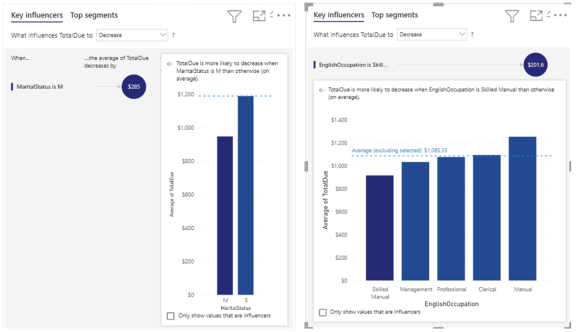
Figure 17. Showing Single and Married Buying Behaviors and Other Customer Demography.
A key influencer in terms of marital status shows that single people are more likely to purchase than married people, while it can be seen from the chart that customers who have a skilled manual as their profession have the least influence in driving revenue.